The Cyber Helpline’s Data Dashboard


Cybercrime, Digital Fraud and Online Harm Analytics and Insights

Track, analyse, and understand the cybercrime landscape with up-to-date data. Stay ahead with trends and insights to protect yourself and your organisation.

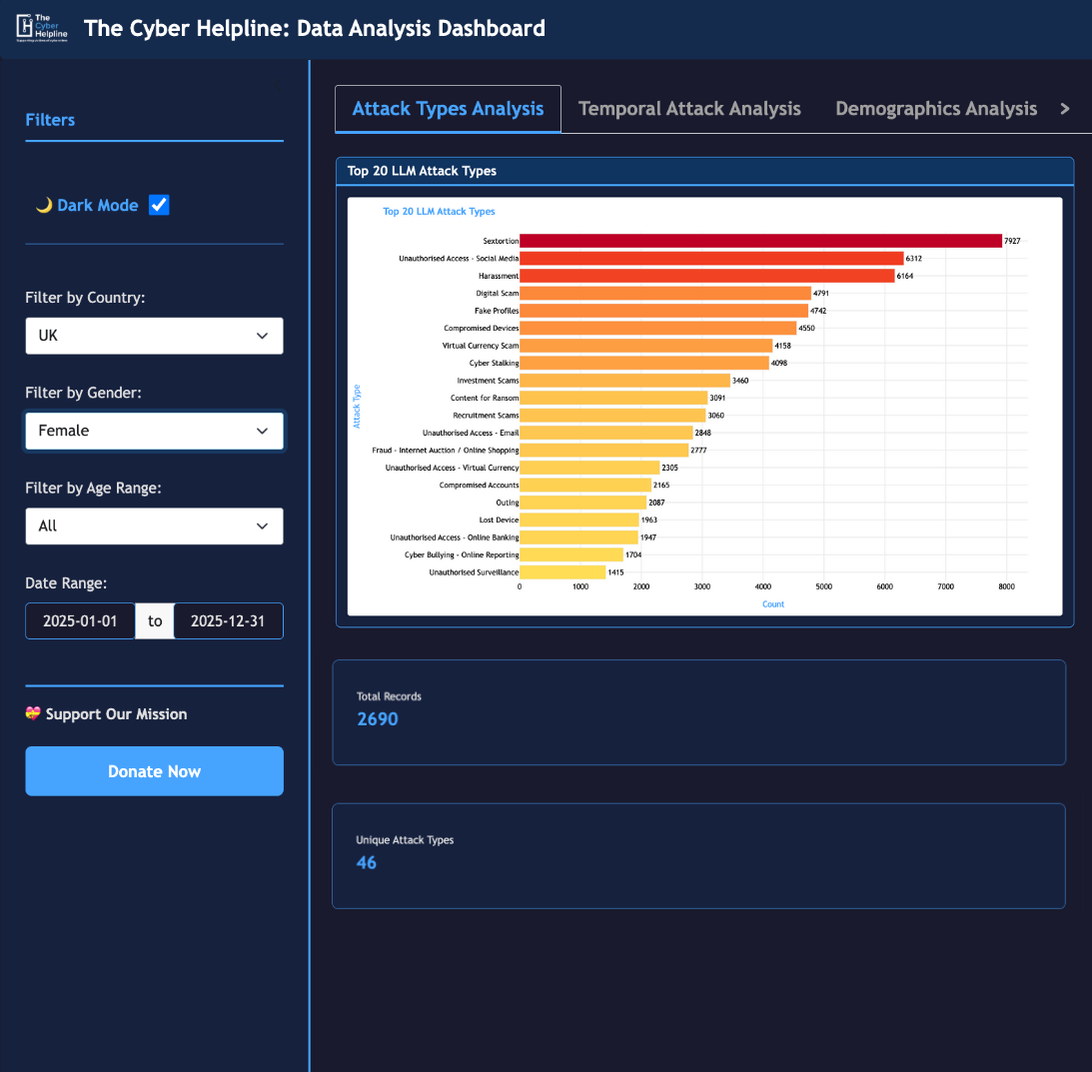
At The Cyber Helpline, we support individuals affected by cybercrime every day. Our cybercrime dashboard provides recent, anonymised data on attacks, demographics, and trends, helping to raise awareness, highlight areas of risk, and enable informed action.

Designed for the public, law enforcement, government agencies, charities, and businesses, the dashboard empowers users to identify patterns, allocate resources effectively, and take steps to prevent cybercrime.


*global trends dashboard drawing from a database of over 40,000 cases, primarily from the UK, USA, and India, spanning 2023 to present (updated monthly)


📊

View current trends

of cyber attacks across the country.

💻

Discover common attack types

including phishing, malware, scams, and social engineering.

👥

Explore demographics

including age and gender, and cybercrime impact by group.

🛡️

Track evolving attack patterns

seasonal spikes, and emerging cyber threats.

Empower Your Response to Cybercrime

Filter, Analyse, Take Action.

 
Explore Data
Filter by attack type, location, and demographics.
Analyse Trends
View interactive charts and visualisations, with downloadable images.
Take Action
Inform policy, prevent attacks, and protect victims.
 

Who Can Benefit

👤

Individuals

Understand the cyber threats most relevant to you.
🔬

Researchers

Leverage datasets to uncover patterns and advance research.
🏘️

Community Organisations

Learn general trends to educate and protect local populations.
📰

Media

Access anonymised, aggregated data to support reporting and awareness campaigns.
🚓

Police & Law Enforcement

Identify hotspots, track criminal patterns, link incidents to perpetrators, and optimise resources.
🏛️

Government & Policy Makers

Monitor regional vulnerabilities, evaluate awareness campaigns, and develop data-driven cyber policies.
🤝

Charities & NGOs

Design targeted support programs, focus on vulnerable communities, and report trends to stakeholders.
🏢

Businesses

Train employees on prevalent threats and enhance corporate cybersecurity programs.


In-Depth Intelligence for Verified Partners

Some insights, such as specific websites linked to attacks, are only available to verified organisations. Request access to explore the full dashboard, analyse trends in depth, and generate sector-specific reports.


Your support can help a cybercrime victim recover faster
Donate Now


Dashboard FAQs

 
  • This dashboard shows aggregated insights from anonymised cybercrime victim case descriptions submitted via The Cyber Helpline’s chatbot. It highlights trends such as attack types, demographics, victim–perpetrator relationships, and platforms or services referenced in reported incidents.

  • All data is sourced from case descriptions from The Cyber Helpline’s chatbot data. No external data sources are included.

  • You can explore case data from March 2023 to present day. The data is updated on a monthly basis.

  • Cases were cleaned to remove duplicates, incomplete records, and spam messages. Personally identifiable information was removed before analysis with a dedicated Python library. Classifications were made using a bespoke large language model (LLM) prompt. The model currently used is ChatGPT 4.1

  • Internal testing shows the classification process performs very well overall. However, mistakes are possible, particularly where case descriptions are brief, vague, or ambiguous. The data should be interpreted as indicative rather than definitive.

  • All personally identifiable information is removed using a dedicated Python library before any AI processing takes place. The dashboard only displays aggregated, anonymised data and cannot be used to identify individuals.

    • Data is limited to users who chose to report incidents via the chatbot.

    • Classifications are model-generated and may contain errors.

    • Reporting behaviour and chatbot usage can influence trends.

  • Data is only available when there is sufficient volume or data quality to support meaningful analysis. In other cases, data may be restricted due to privacy considerations, limited availability, or because certain features are still under development.

  • Monthly.